Environmental sustainability.

We’re committed to playing our part.

Reimagining a healthier planet.

People need a healthy planet to live their healthiest lives. 

Our climate transition plan.

Discover our comprehensive approach to achieving a 1.5-degree pathway transition to Net Zero, our governance structures, climate risk management strategy, decarbonization initiatives, and the progress and challenges in meeting our climate goals.

Our environmental sustainability strategy at a glance.

We are dedicated to reaching Net Zero GHG emissions by 2040, covering Scope 1, 2, and 3 emissions.

Scope 1

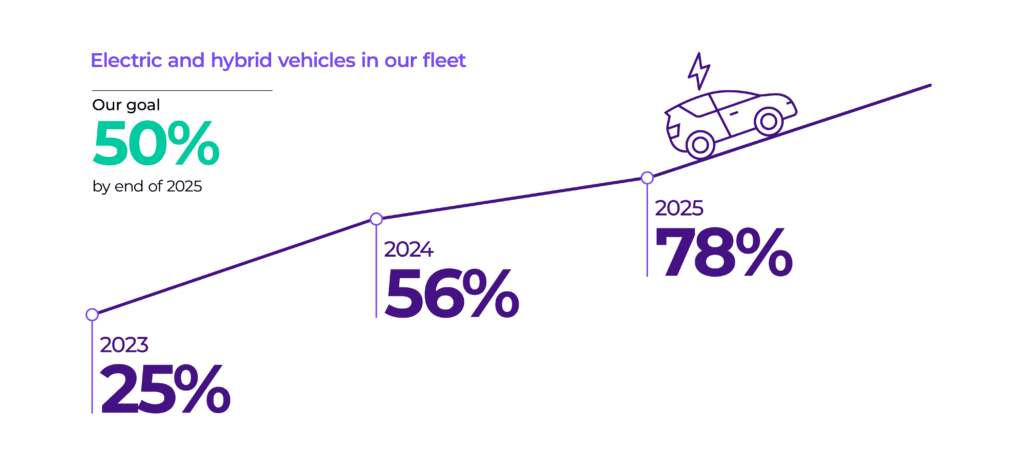
Fleet Transition:

Transition to fully electric fleet by 2030.

Scope 1

Scope 2

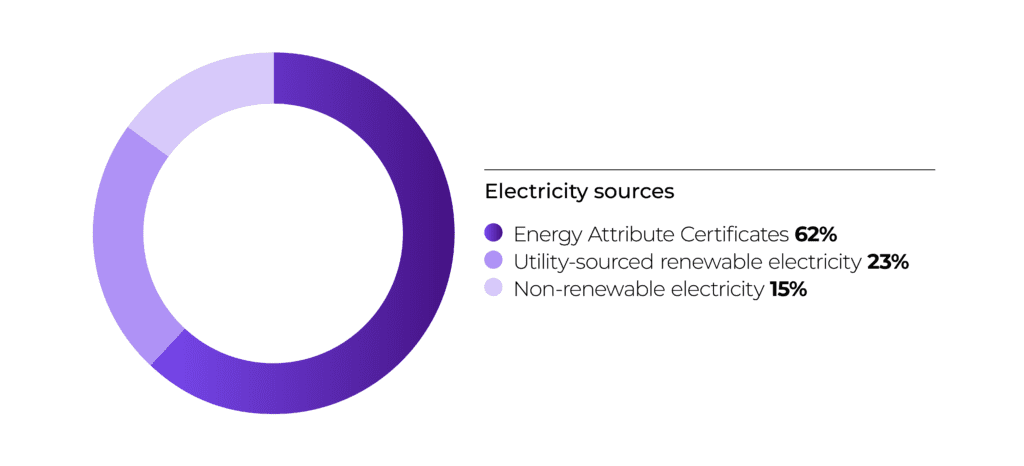
Electricity Sourcing:

Procure 100% of electricity from renewable sources by 2030.

Scope 2

Scope 3

Understanding our suppliers:

Drive reductions in emissions from purchased goods and services.

Business travel:

Encourage “virtual first” as an alternative.

Scope 3

Our emissions.

 Carbon emissions 
Scope Absolute emissions (tCO2e) 
2021  2022  2023  2024  2025 7 
Scope 1  8,008  11,900  5,919  3,861  4,482Δ 
Scope 2 (location-based)  2,309  2,315  1,945  1,418   1,573Δ 
Scope 2 (market-based)  2,846  874  311  194  242Δ 
Total Scope 1 and Scope 2 (market-based)  10,854  12,774  6,230  4,055  4,724 
Total Scope 3  18,679  36,540  30,210  35,476   34,158Δ 
Total market-based emissions (Scope 1, Scope 2 (market-based) and Scope 3)  29,533  49,314  36,440  39,531  38,882 
Tonnes of CO2e (Total market-based emissions) per US$1m revenue1   -  31.2  22.4  25.7  24.0Δ 
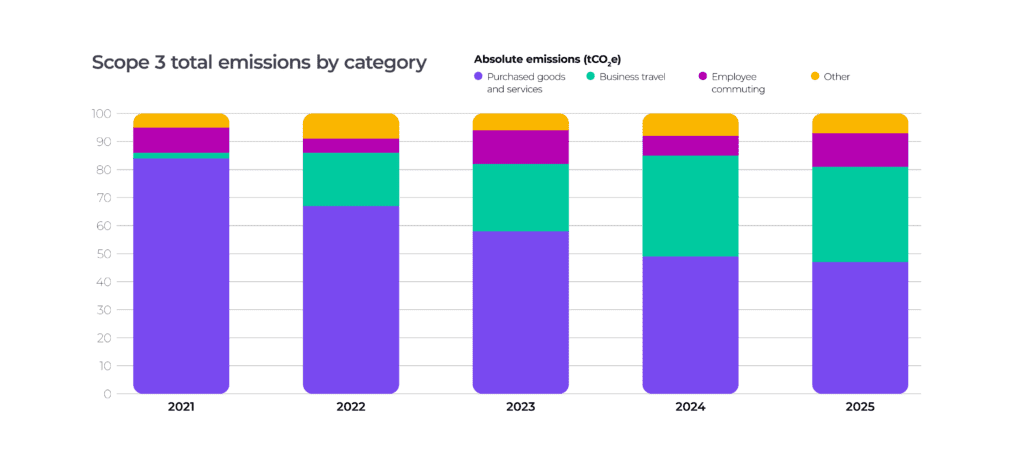
Scope 3 total emissions by category
Sources of Scope 3 emissions Absolute emissions (tCO2e)
Baseline year (2021)  2022  2023  2024  2025 
1Purchased goods and services  15,678  24,273  17,407  17,257  15,958 
Water 2 11  28  96     
2Capital goods 3        739  322 
3. Fuel and energy-related activities not included in Scopes 1 and 2  495  3,244  1,155  1,439  1,523 
4. Upstream transportation and distribution 4  1.5  2.9  540  141  275 
5. Waste generated in operations  451  95  172  23  37 
6. Business travel 5  442  7,001  7,094  12,873  11,559 
7. Employee commuting    1,897  3,746  2,608  4,086 
Downstream emission categories 
15. Investments 6        534  398 
Total Scope 3emissions  18,679  36,540  30.310  35,376  34,158 Δ 


References

1 . Total market-based emissions divided by Adjusted Net revenue (excluding Accordience) 

2. Emissions from water supply are included in Purchased goods and services and water treatment under Waste.  

3. Emissions relating to Capital goods were previously included within Purchased goods and services.  

4. Our calculation methodology for emissions relating to Upstream transportation and distribution was refined in 2024.  

5. This number recognizes our full business travel emissions and does not account for the purchase of carbon offsets.  

6. Category 15 emissions relate to our investment in our joint venture, CMIC Inizio.  

Δ Metrics subject to limited assurance by EY in accordance with ISAE 3000 (Revised)/ISAE 3410. Please refer to our 2025 Sustainability Reporting Criteria document and EY’s limited assurance report on our website.